Demographics of the United States

The United States is the third most populous country in the world, and the most populous in the Americas and the Western Hemisphere, with an estimated population of 340,110,988 on July 1, 2024, according to the U.S. Census Bureau.[1] This was an increase of 2.6% over the 2020 federal census of 331,449,281 residents.[2] These figures include the 50 states and the federal capital, Washington, D.C., but exclude the 3.6 million residents of five unincorporated U.S. territories (Puerto Rico, Guam, the U.S. Virgin Islands, American Samoa, and the Northern Mariana Islands) as well as several minor uninhabited island possessions. The Census Bureau showed a population increase of 0.98% for the twelve-month period ending in July 2024,[3] slightly below the world estimated annual growth rate of 1.03%.[24] By several metrics, including racial and ethnic background, religious affiliation, and percentage of rural and urban divide, the state of Illinois is the most representative of the larger demography of the United States.
Population pyramid of the United States in 2023
Population Increase 340,110,988 (2024 estimate)[1]
331,449,281 (2020 census)[2]
Density 86.16/sq mi (33.27/km2)
Growth rate Increase 1% (2024)[3]
Birth rate Decrease 10.7 births/1,000 population (2023)
Death rate Positive decrease 9.2 deaths/1,000 population (2023)
Life expectancy Increase 78.4 years (2023)[4]
• male Increase 75.8 years (2023)[4]
• female Increase 81.1 years (2023)[4]
Infant mortality rate 5.4 deaths/1,000 live births (2020)[5]
Net migration rate 3 migrant(s)/1,000 population (2024)[6]
Age structure
Under 18 years 21.7% (2023 est.)[7]
18–44 years 36.0% (2023 est.)[7]
45–64 years 24.6% (2023 est.)[7]
65 and over 17.7% (2023 est.)[7]
Sex ratio
Total 0.98 male(s)/female (2023 est.)[7]
At birth 1.045 male(s)/female (2022)[8]
Under 15 1.05 male(s)/female (2023 est.)[7]
15–64 years 1.01 male(s)/female (2023 est.)[7]
65 and over 0.82 male(s)/female (2023 est.)[7]
Nationality
Nationality American
Major ethnic
Major ethnic groups
Minor ethnic
Minor ethnic groups
Language
Official English
See:
Spoken
Primary language at home:
English, 78.5%
Spanish, 13.2%
Other Indo-European, 3.7%
Asian and Pacific Islander, 3.3%
Other, 0.8%
Source: American Community Survey of U.S. Census Bureau[23]
Population
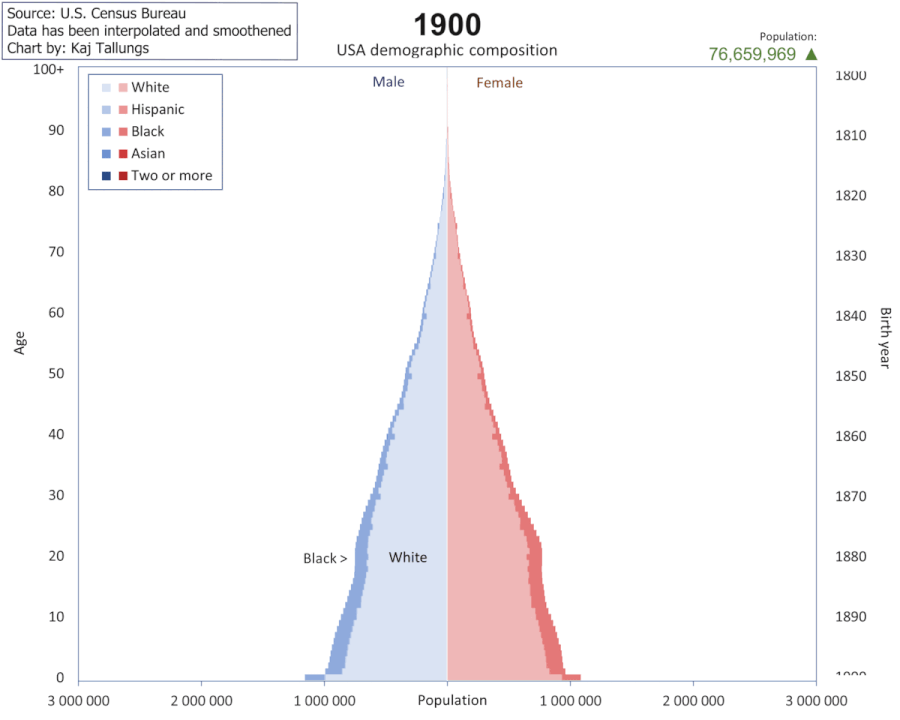
In 1900, when the U.S. population was 76 million, there were 66.8 million white Americans in the United States, representing 88% of the total population,[39] 8.8 million Black Americans, with about 90% of them still living in Southern states,[40] and slightly more than 500,000 Hispanics.[41]
Under federal law, the Immigration and Nationality Act of 1965,[42] the number of first-generation immigrants living in the United States has increased,[43] from 9.6 million in 1970 to about 38 million in 2007.[44] Around a million people legally immigrated to the United States per year in the 1990s, up from 250,000 per year in the 1950s.[45]
In 1900, non-Hispanic whites comprised almost 97% of the population of the 10 largest U.S. cities.[46] The Census Bureau reported that minorities (including Hispanic whites) made up 50.4% of the children born in the U.S. between July 2010 and July 2011,[47] compared to 37% in 1990.[48]
In 2014, the state with the lowest fertility rate was Rhode Island, with a rate of 1.56, while Utah had the greatest rate with a rate of 2.33.[49] This correlates with the ages of the states’ populations: Rhode Island has the ninth-oldest median age in the US – 39.2 – while Utah has the youngest – 29.0.[50]
In 2017, the U.S. birth rate remains well below the replacement level needed – at least 2.1 children per woman so as not to experience population decreases – as white American births fell in all 50 states and the District of Columbia. Among non-Hispanic white women, no states had a fertility rate above the replacement level. Among non-Hispanic Black women, 12 states reached above the replacement level needed. Among Hispanic women, 29 states did.[51] For non-Hispanic white women, the highest total fertility rate was in Utah, at 2.099, and the lowest in the District of Columbia, at 1.012. Among non-Hispanic Black women, the highest total fertility rate was in Maine, at 4.003, and the lowest in Wyoming, at 1.146. For Hispanic women, the highest total fertility rate was in Alabama, at 3.085, and the lowest in Vermont, at 1.200, and Maine, at 1.281.[51][52] As of 2016, due to aging, low birth rates and rising mortality driven partly by drug overdoses, deaths outnumber births among non-Hispanic whites in more than half the states in the country.[53]
Source: wikipedia


